
Performance is more than a good score. A website has to become visible quickly, respond to input without delay and stay stable while it loads. That is what Core Web Vitals are for: they translate technical loading and interaction problems into metrics that sit closer to real user experience than file sizes or server timings. And they are not cosmetic — a study by Google and Deloitte found that just 0.1 seconds of faster mobile load time increased retail conversions by 8.4% (web.dev: Milliseconds make millions).
In 2026 the bar is also stricter than before: since 12 March 2024, Interaction to Next Paint (INP) is the official responsiveness metric and has replaced First Input Delay (web.dev). Taking performance seriously means optimising not for a pretty demo, but for what real users experience in the field.
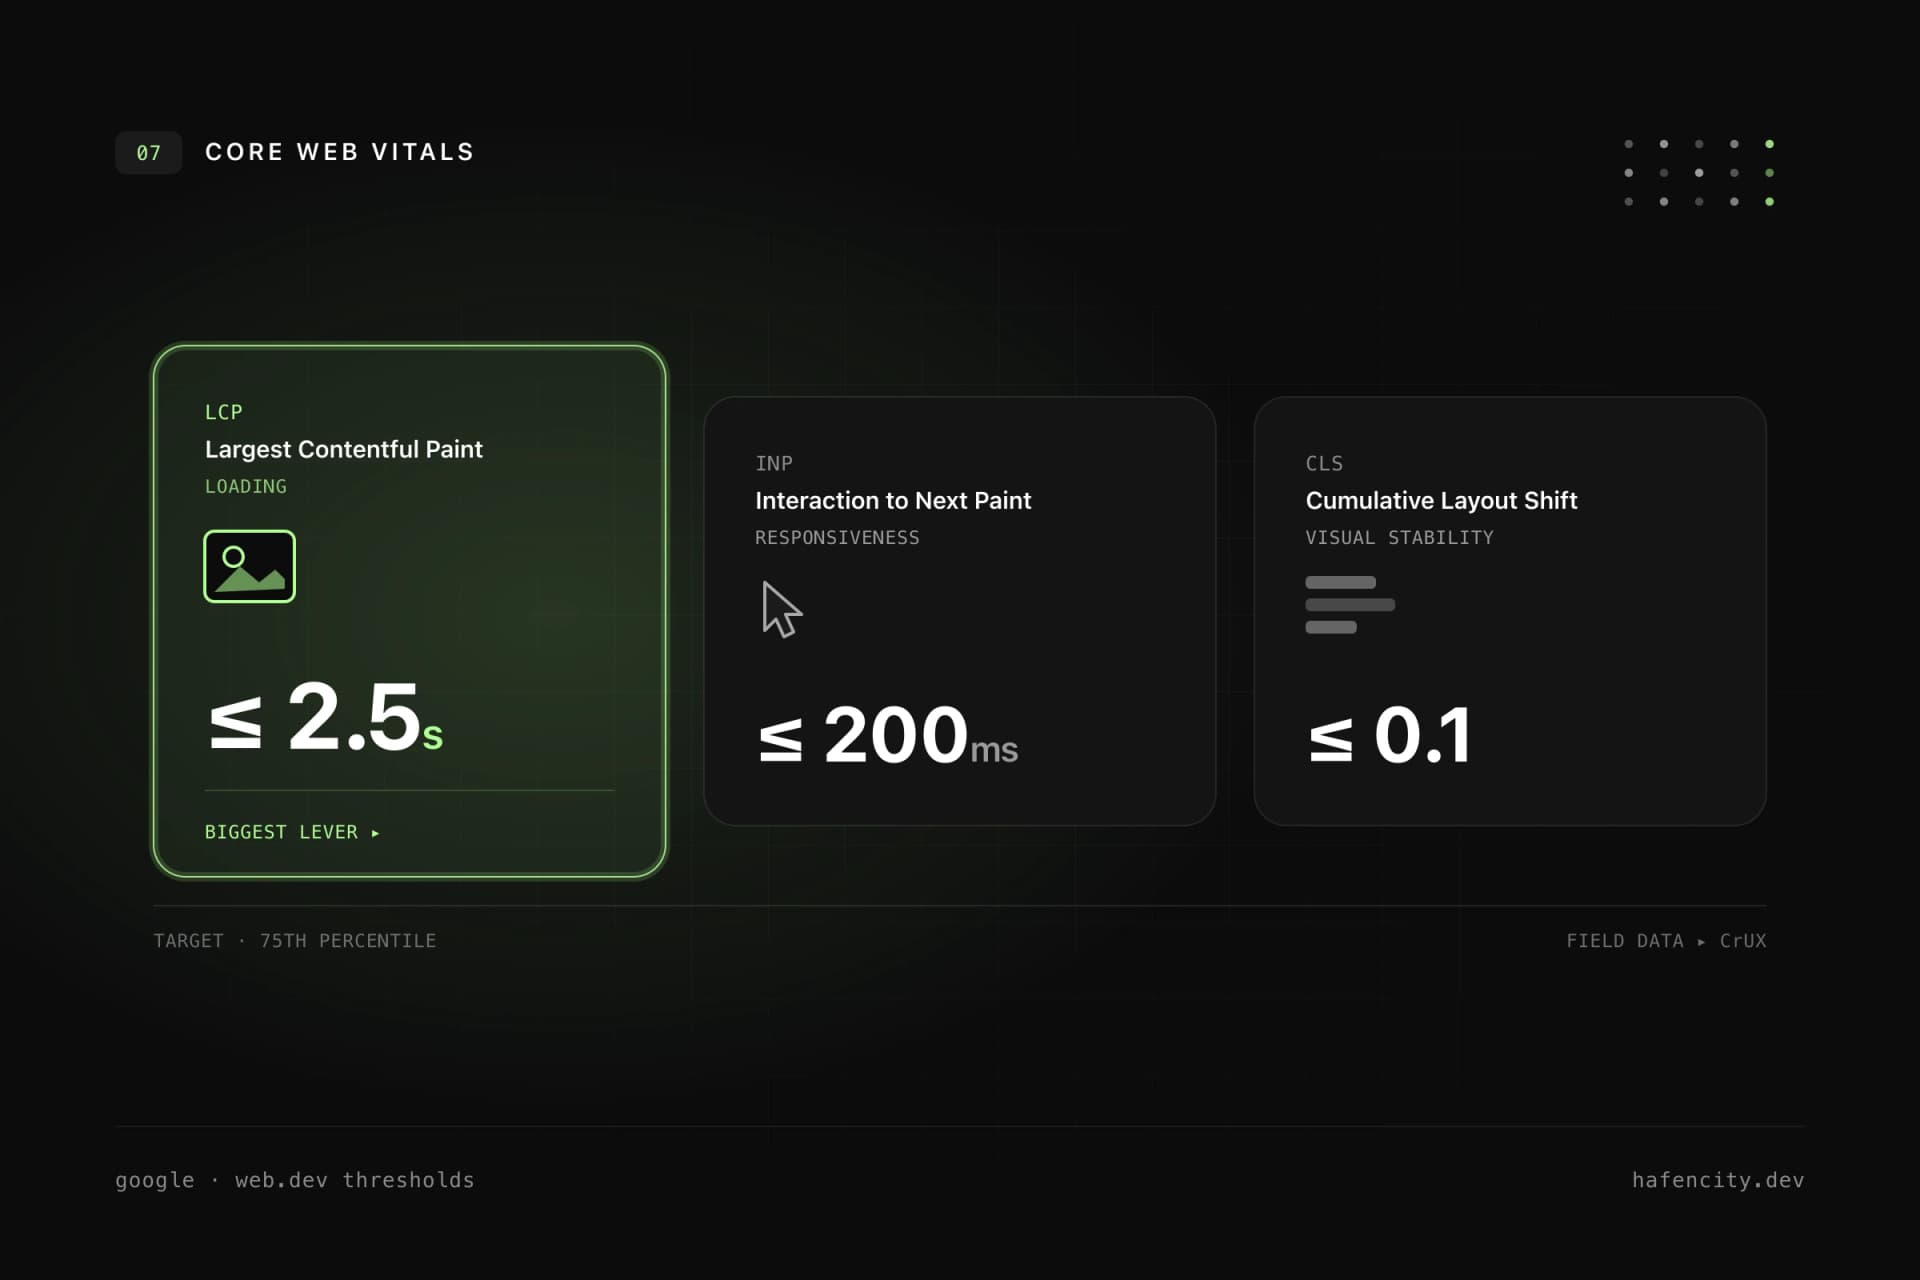
What Core Web Vitals measure — and the 75th-percentile test
Core Web Vitals capture user experience across three dimensions: loading, responsiveness and visual stability. Each has a clear threshold that Google evaluates at the 75th percentile of real page views (web.dev: Core Web Vitals thresholds). That means the best lab run does not count — what counts is that 75% of real views perform well, over a rolling 28-day window.
| Metric | Good | Needs improvement | Poor |
|---|---|---|---|
| LCP (loading) | ≤ 2.5s | ≤ 4.0s | > 4.0s |
| INP (responsiveness) | ≤ 200ms | ≤ 500ms | > 500ms |
| CLS (visual stability) | ≤ 0.1 | ≤ 0.25 | > 0.25 |
The logic behind it matters: a single value is not enough. A page only counts as fast when all three metrics clear their threshold. These three axes — visible, usable, stable — are exactly the moments where users experience a website as high-quality or as sluggish.
Why speed feeds revenue directly
Performance is not a technical hobby — it is a business factor with measurable impact. The much-cited "Milliseconds make Millions" study by Google, 55 and Deloitte analysed over 30 million user sessions across 37 brand websites. The result: just 0.1 seconds of faster mobile load time increased conversions by 8.4% in retail and 10.1% in travel, with average order value in retail up 9.2% (Deloitte).
Then there is SEO: Page Experience including Core Web Vitals is a Google ranking signal, though not a dominant one — good content still beats raw speed (Google Search Central). Taken together: performance improves perception, conversion and discoverability at the same time. How these dimensions interact is something we go deeper on in Quality Is Measurable: Performance, Accessibility and SEO.
Improving LCP, INP and CLS deliberately
Each metric has its own lever — and none is solved by a single trick. A poor value usually comes from several small bottlenecks that add up.
LCP — make the main content visible sooner. The LCP candidate is often a hero image or a large heading. What helps: faster server response (TTFB, caching, no unnecessary redirects), not lazy-loading the most important image but delivering it early with fetchpriority="high", reducing render-blocking CSS and JavaScript, and a CDN for static assets.
INP — respond quickly to interaction. INP measures how long the page takes to visibly respond after a click, tap or keystroke. Common causes are large JavaScript bundles, long tasks on the main thread and expensive event handlers. The fix is doing less work at the critical moment — code splitting, server-side rendering, lean components, debouncing and Web Workers for expensive calculations.
CLS — keep the layout stable. Shifts happen when images load without fixed dimensions, banners appear late or fonts reflow text. Reserve fixed space: width and height or aspect-ratio for media, fixed space for ads and cookie notices, metric-compatible fallback fonts, and animations via transform instead of layout properties.
Where load time is lost: images, fonts, JavaScript
Before reaching for micro-optimisations, look at the three big culprits. On most websites they account for the majority of load time.
- Images are often the single largest item. An image should only be transferred at the size that makes sense in the viewport — with
srcset/sizes, modern formats (WebP, AVIF), real dimensions in the markup and lazy loading for everything below the first viewport. The LCP image is the exception and gets prioritised. - Fonts strengthen the brand but can hurt LCP and CLS. Load only the weights you need, self-host where it helps, preload only the important ones and configure
font-displayand fallback metrics deliberately. - JavaScript is often why a page looks loaded but is not usable. Not every UI element needs to be a client component; code splitting, removing unused dependencies and minimising hydration noticeably lower INP.
Two ongoing disciplines round this out: caching (long cache lifetimes for versioned assets, CDN, stale-while-revalidate, Brotli/gzip) and a strict eye on third-party scripts. web.dev recommends auditing analytics, chat widgets, A/B tools and maps regularly (web.dev). The honest question: does this script have a clear business value — or does it just cost load time permanently?
Lab data or field data — using both correctly
The most common mistake is looking only at one Lighthouse run. Lab data is reproducible and ideal for debugging, but it does not fully capture real-world bottlenecks — PageSpeed Insights notes this itself. Assessment happens in the field: from real user data in the Chrome User Experience Report.
In practice the two perspectives complement each other: lab data for development, pull requests and regressions, field data for how real users experience the page, and your own real-user monitoring to separate by page, device and country. A good lab score is a starting point — Core Web Vitals have to stay stable in the field. That same standard carries a project through a website relaunch without losing performance.
Next steps
Three questions create clarity fast before you optimise:
- Field data: how do your most important page types — homepage, landing page, product/service page — perform at the 75th percentile?
- Biggest lever: is it the LCP image, the JavaScript budget or a shifting layout?
- Durability: is performance part of your quality assurance, or a one-time project?
If you want stable field data rather than just a score, we will look at your pages concretely — pragmatically and with an eye on roadmap and budget. Take a look at our web development or book an intro call directly.